Bay of Plenty Kiwifruit 2017-18 Season Review
As first seen in the Orchardist, July 2018
Toni Stringfield, Fruition Horticulture, Bay of Plenty
The basics of growing a good crop don’t vary, but variations in climate from season to season can affect on orchard operations for growth of the current crop, and how the vines are set up for the following season. For example, in a season with high rainfall, more rounds of summer pruning may be required.
So what did the Bay of Plenty weather contribute to growing the 2017-18 kiwifruit crop?
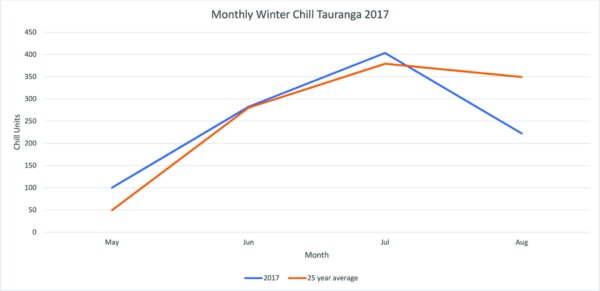
Winter Chill
The season started off well enough with winter chill, as measured at Tauranga Airport, being close to the 25-year or, for the purposes of this article, long-term (LT) average through May, June and July. Winter chill dropped sharply in August, ending up 127 units below the average of 349. See winter chill graph.
Temperature
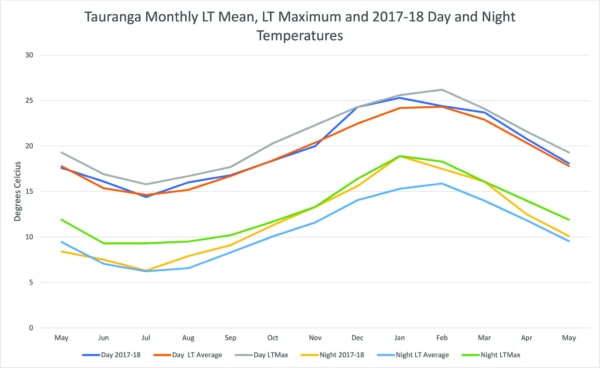
Those warm August overnight temperatures were a harbinger of what was to come through the growing season. In the average monthly temperatures graph I have removed the day and night LT minimum line, because this year it just isn’t relevant to what happened. Temperatures from May 2017 through to May 2018, both during the day and at night, were predominantly between the LT average and LT maximum. Overnight temperatures were high from October through to March with new 25 year highs in November, January and March. High daytime temperatures really only featured in December and January, with another small peak in March.
Sunshine
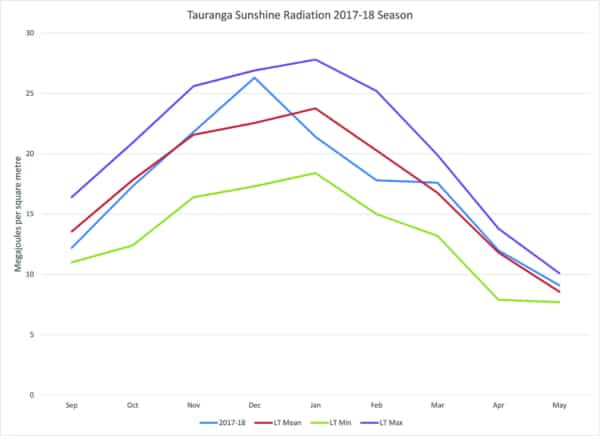
Sunshine through the 2017-18 growing season hovered around average though the spring months of October and November and again towards the close of the season from March to May. The daytime temperature peak in December coincided with a peak in sunshine, but the high temperatures in February were driven by other factors as sunshine through January and February dropped below average.
Rainfall and Soil Moisture
It has been wet in the Bay of Plenty.
The 2016-17 growing season ended with record rainfall and flooding in Edgecumbe.
June finally gave some respite with a drier than average month. The rest of the winter however and through into spring gave average or higher than average monthly rainfall totals.
Rain finally slowed in November and December, with well below average rainfall of 49 and 29mm respectively. That was the end of the respite, as a number of tropical cyclones headed to their end over New Zealand later in summer. February 2018 rainfall at Tauranga airport was the same as in 2017 to within 1mm at 154mm, well above the average of 89mm. March rainfall was close to average at 85mm and finally some more drier months with 119mm in April and a relatively scant 71mm in May.
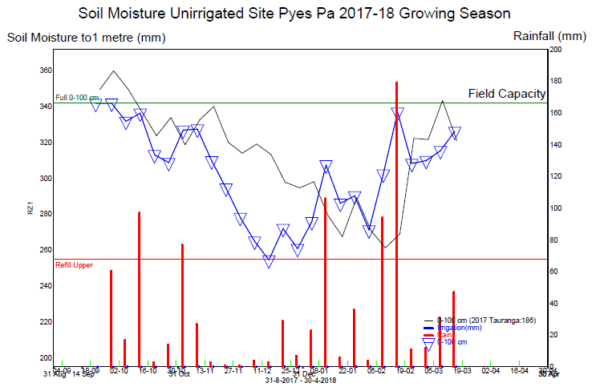
Our soil moisture monitoring reflected the rainfall patterns above with soils at or near field capacity at the start of the season in late September then drying through November and into December. Spikes in soil moisture occurred as the January and February cyclones came through and levels remained close to field capacity as our monitoring season finished in mid-March.
In the soil moisture graph, the red bars are rainfall, using the scale on the right. The lines show weekly soil moisture levels from September to March. The blue line refers to the current 2017-18 season, the black line to the previous season.
Wind
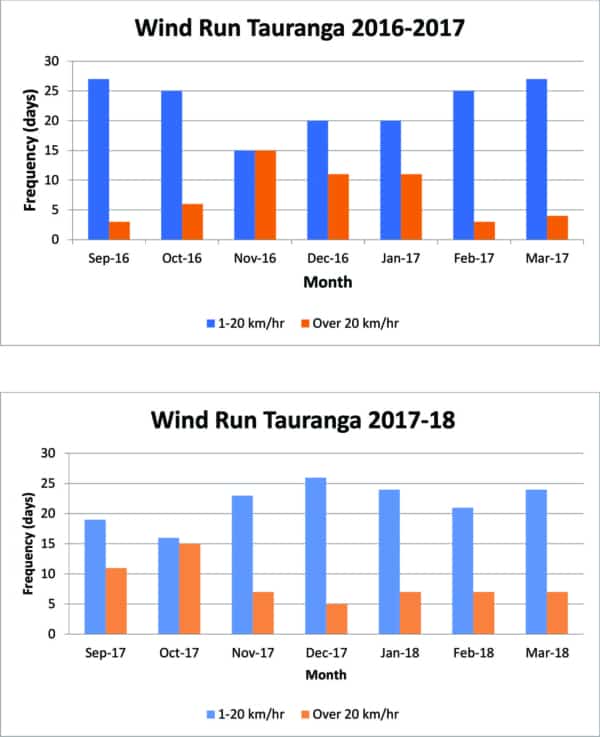
Where last season, we had calmer winds at the start of the season and then higher wind run days through November, December and January, it was the other way around in 2017-18.
We started the season in September and October with 26 of 61 days having an average wind speed of 20 kilometres per hour (km/h). 20 km/h is at the lower end of ‘moderate breeze’ on the Beaufort scale. Winds in this category, create 1-2 metre high waves, will lift dust and move small branches.
At the start of November the winds dropped and through to the end of January there were only 19 days out of 92 that averaged a wind speed in excess of 20 km/h. The pattern continued with February and March both recording 7 days each with an average wind speed over 20km/h. See wind run graphs.
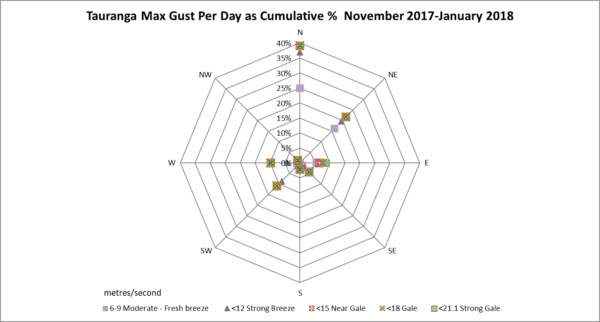
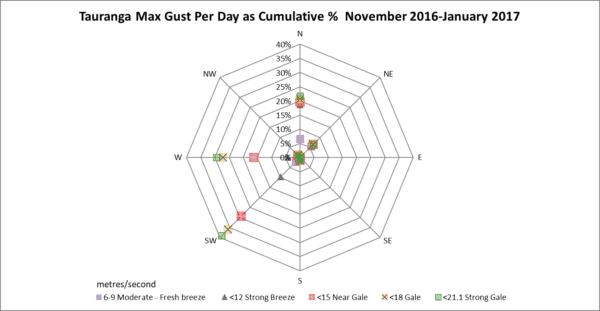
The other unusual aspect to the wind over the November to January 2018 period, is direction. Prevailing wind direction in the Bay of Plenty is west and south-west, as occurred in the 2016-17 season when 70% of daily wind gusts were from that quarter. These are strong winds which in the 2016-17 season included 1-2 gusts at strong gale, ie 18 – 21.1metres per second (m/sec).
Conversely, over the same November to January period in the 2017-18 season 40% of daily wind gusts were from the north and a further 20% were from the north-east. This is the typical direction for a La Niña dominated summer season, which was officially acknowledged in early December. These were not strong winds either with just 1-2 wind gusts occurring at a maximum of 12-15m/sec. See wind rose graphs.
Reading the Wind Rose Graphs
Because wind rose graphs are not a square graph with lines or columns, that we are familiar with, some people may be put off trying to grasp the information that they convey. However, the difference in wind direction and strength between the 2016-17 season and 2017-18 season makes it easy to understand how these wind rose graphs work.
We can see in the 2016-17 season graph that the markers are all spread out, right up to the maximum wind strength on the west and south west axes. This indicates that we had a range of wind strengths right up to strong gale and that these strong winds were overwhelmingly from the west and south-west. There was an occasion or two when there was strong wind from the north with the markers for a strong breeze, near gale, gale and strong gale, just a little bit spread out and not quite all piled on top of each other.
By contrast the 2017-18 wind rose graph has many of the markers are piled on top of each other in just about all directions, indicating that there were few strong winds in the 2017-18. Where there is some spread of the markers it is in the north and north-east direction, but this spread is just among the lighter winds, all the gale markers are still piled on top of each other.
Summary
The 2017-18 Bay of Plenty kiwifruit growing season featured high temperatures, both during the day, but particularly overnight and was also notable for a lack of wind. Other climate inputs that might impact the growing of the crop, rainfall and sunshine, whilst they had their ups and downs were not persistently above or below average, nor subject to major spikes that would eclipse all other data in impacting the crop in the way rainfall did for growers particularly on the Edgecumbe plains late in the 2016-17 season.
Overall 2017-18 Bay of Plenty kiwifruit growing season climate inputs stack up as mostly average, and therefore benign, meaning good on orchard practices should have rewarded growers at the packhouse.