Hawke’s Bay apple harvest – the season that was
As first seen in the Orchardist, May 2019
Danielle McArley and Jack Hughes Fruition Consultants, Hawkes Bay
The 2019 apple harvest season in Hawke’s Bay started well with a period of sunny days and cooler nights popping the colour in Gala varieties. Gala size was a different story with smaller fruit than most recent seasons. Since then, NZAPI Maturity Monitoring Data is showing that later season varieties are struggling to reach preferred size, colour and sugar levels. There are lots of views and observations- “Starches are racing, firmness is holding, size is down, colour isn’t there”.
Can these outcomes be explained? This article considers some of the environmental influences and relevant scientific evidence to discuss seasonal effects on fruit quality and physiology.
The evidence
The weekly maturity monitoring of the major varieties on Hawke’s Bay orchards provides a valuable industry resource. A review of the last five years data helps to quantify opinions. Comparisons of maturity and quality are complicated because bloom and harvest dates differ every season along with temperatures, rainfall, crop load … the list goes on. As discussed in a previous Orchardist article (“What influences Royal Gala fruit size”, Jack Hughes, February 2019), we can eliminate the calendar date effect on measures of fruit quality by displaying data using starch pattern index (SPI, a measure of maturity progression) on the x-axis. This takes some of the harvest date ‘noise’ out to more clearly show any seasonal differences.
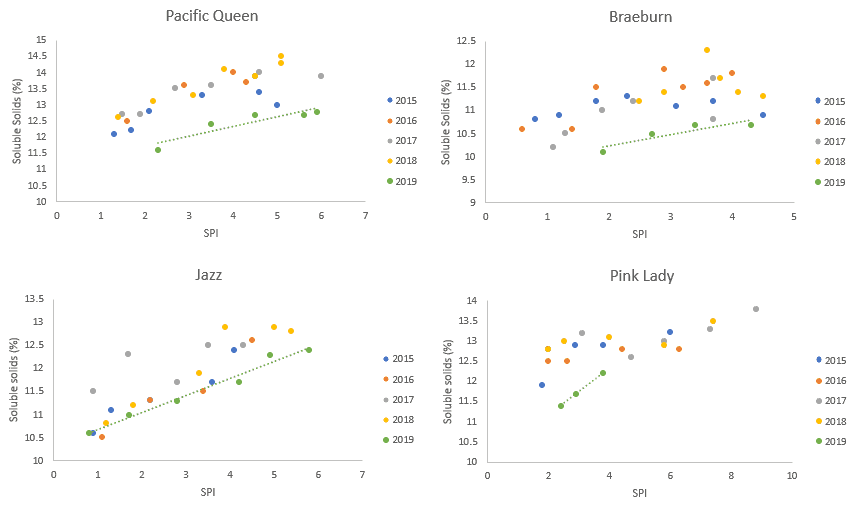
2019 firmness has tracked in line with other seasons when measured against SPI (data not presented). However, average soluble solids and fruit weight tell a different story. Each of the four mid-late season varieties shown below are showing lower soluble solids at a given SPI in 2019 than the previous four seasons (Figure 1).
Figure 1. Soluble solids measured against SPI
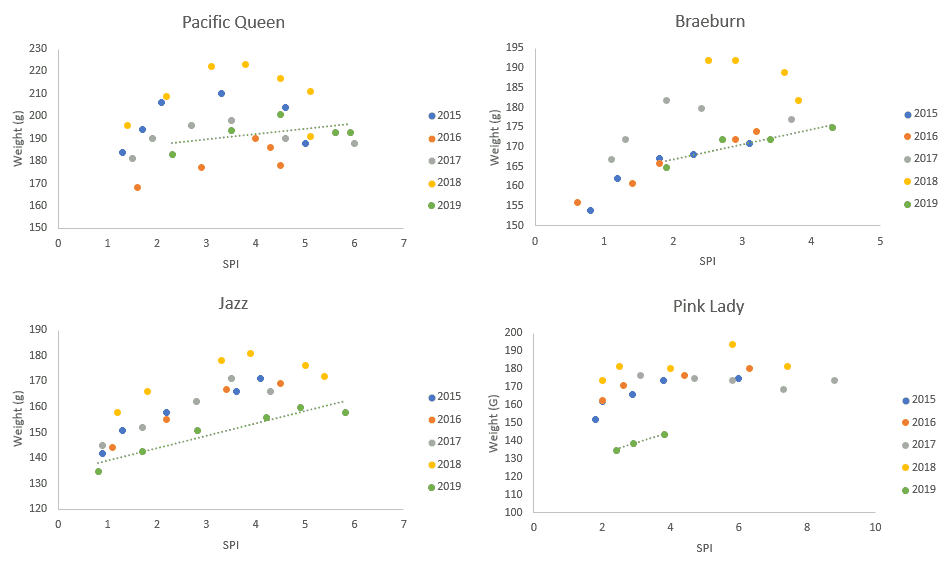
Average fruit weights relative to SPI appear more variety dependant. 2019 Pacific QueenTM and Braeburn are similar to other previous seasons (Figure 2). JazzTM and Pink LadyTM on the other hand are consistently lighter in 2019 compared to the last four seasons. For these two varieties, the magnitude of the size reduction is enough to have downstream effects on packing and marketing.
Figure 2. Fruit weights measured against SPI
Searching for explanations
Rainfall distribution
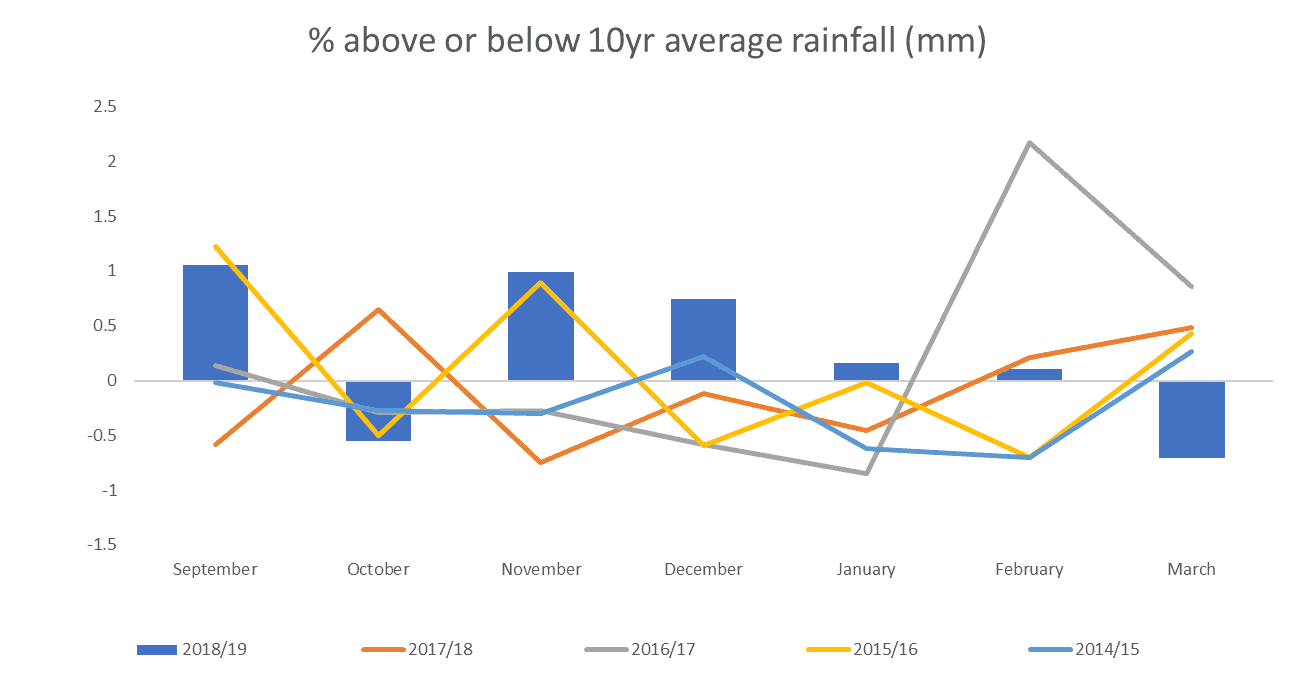
The distribution and amount of rainfall has been raised as a causal factor with the plentiful rainfall in November and December and its effects on trees and their root systems cited as a possible influencing factor (figure 3).
Figure 3. Monthly rainfall expressed as a percentage of normal
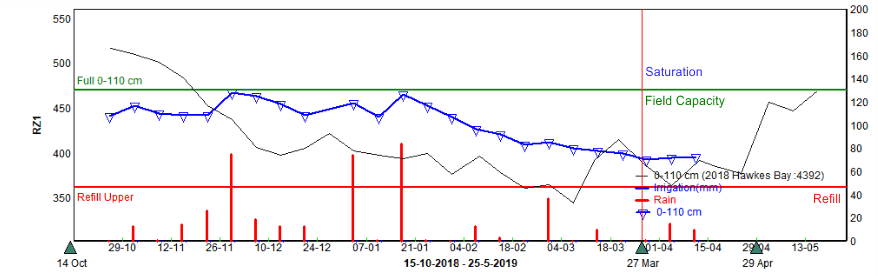
In a review of soil moisture levels measured with neutron probes at various depths, we conclude that saturated and anaerobic conditions seldom occurred during the 2018/19 season. Soil moisture from bloom generally started off lower in 2018 than 2017 and rarely exceeded field capacity through the season. Figure 4 shows a heavy soil that was monitored over the past two years. This site was saturated heading into the 2017/18 season, but was below field capacity for almost the whole season in 2018/19. Apart from isolated situations of over-irrigation or poorly drained blocks, we don’t believe that soil water induced tree stress is a likely cause of poor orchard performance this season.
Figure 4. Soil moisture graph showing water levels in the rootzone for a ‘heavy’ soil from 29/10/18 to 15/04/19, measured over three tubes with a neutron probe. The blue line shows the current soil moisture that is readily available to the plant, and the thin black line represents the soil moisture levels for this site last year
Growing Degree Days
Early season Growing Degree Day accumulation (base 10) was lower and slower in 2018-19 than in the average of previous seasons. This pattern reversed from mid-December when GDD accumulation tended to be higher than normal (figure 5).
Figure 5. Seasonal GDD accumulation expressed as a percentage of normal
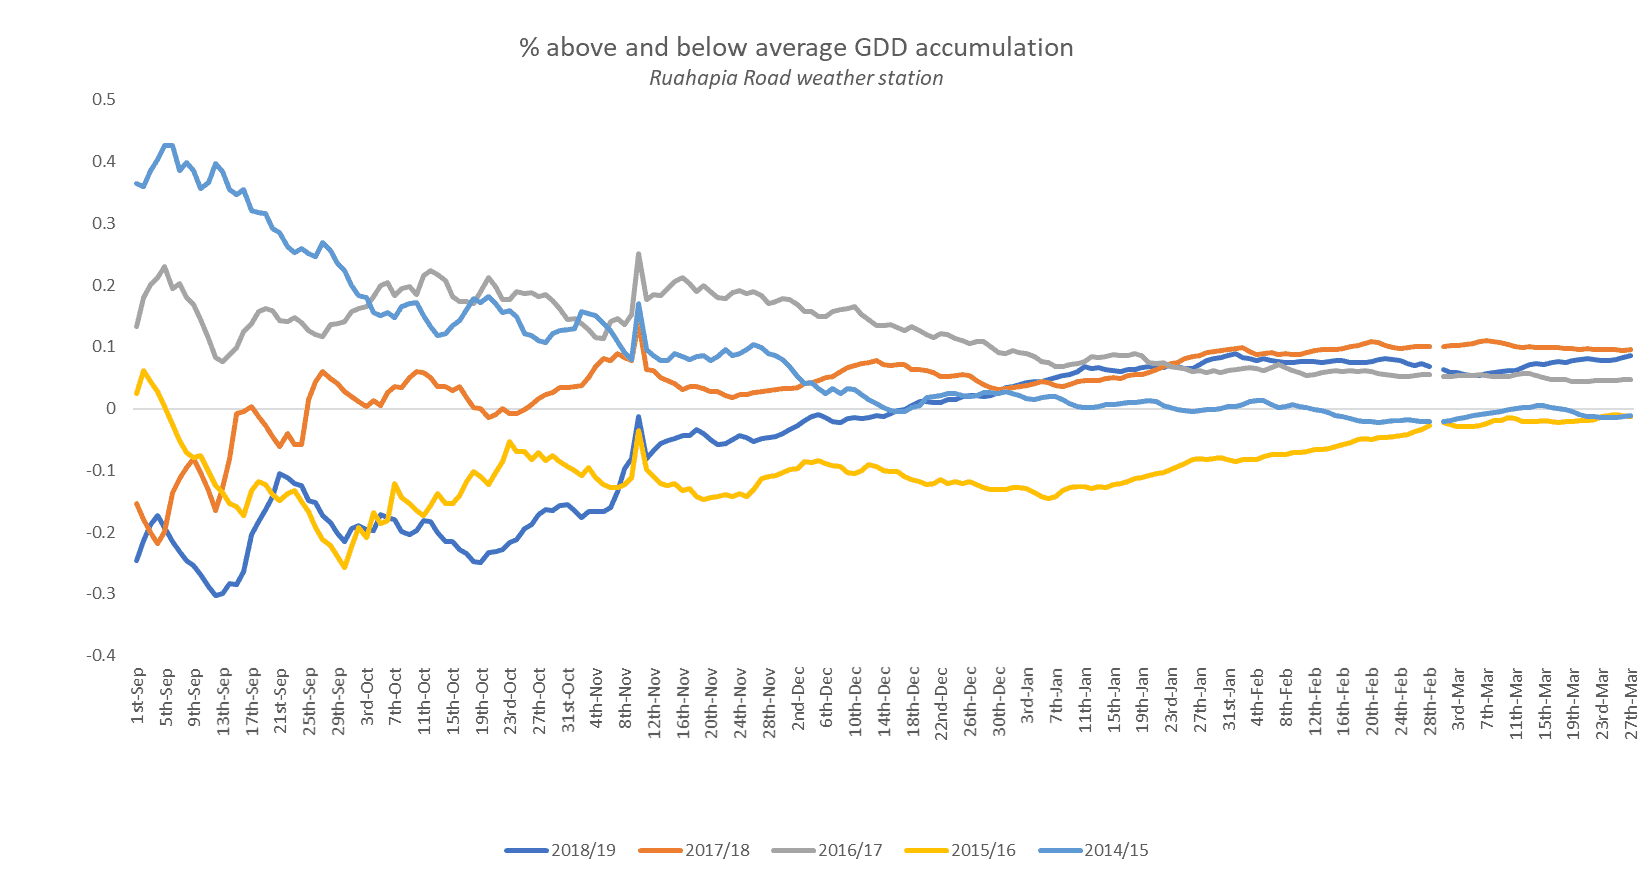
The importance of temperature during the first 30- 50 days after full bloom (DAFB) is well documented for its effect on fruit set, fruit growth rates and finally, fruit size (Warrington et al., 1999; Stanley et al., 2001; Calderon-Zavala et al., 2004). The implication of this is that during cell division (in which the period varies between varieties) fruitlets are much more sensitive to temperature variation than during cell expansion (approx. <50 DAFB,).
In climate laboratory studies, Warrington et al found that early season fruit growth rates (up to 40 DAFB) were significantly affected by temperature, with fruit exposed to 25 day/12 night oC having an 8-fold increase in mean diameter from 10 to 40 DAFB compared to fruit held at 9/3oC. However, when transferring these trees to a warmer sheltered site, there was a marked increase in fruit growth rate, suggesting that the cell division rate, under cooler temperatures, can extend out past 40 DAFB. The impact on final fruit size was not reported.
The impact of temperature on fruit growth rate and final size at harvest were different between varieties tested in these studies. For example, Braeburn showed it was able to sustain growth rate and adequate size in the cooler climate when compared to Royal Gala. Similar studies on more recently developed varieties hasn’t been published. Does the Hawke’s Bay maturity monitoring data (Figure 2) suggest that fruit growth of JazzTM and Pink Lady are strongly influenced by early season GDD’s?
Fruit growth
The fruit growth curve is not widely understood but generally can be separated into two phases (Lakso et al., figure 5):
- Cell Division: Begins once the flower has been fertilised. The period differs by variety but can be between 30—50 days after full bloom (DAFB). This is the stage where cells are actively dividing to a final number,
- Cell enlargement or expansion: During and after cell division has finished. During this phase, the apple puts on a similar amount of weight per day until harvest.
Both processes can be affected by crop load and temperature.
Figure 6. The seasonal pattern of apple fruit growth by weight with no crop or environmental limitations (Lakso et al., 2017)
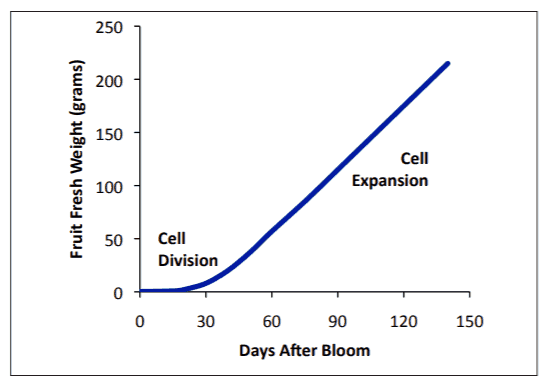
From this research, we can conclude that temperature over the first 30-50 DAFB is one important factor in final fruit size at harvest, however it alone is not the only factor, nor is it a straight forward predictor when considering the range of commercial varieties and the different combinations of environmental conditions we face each year.
Temperature effects on fruit maturation
As mentioned, 2018-19 was a season of two halves. The beginning (October-December) temperatures were cool and GDDs were well below average during the cell division and expansion phase of apple growth. The second half of the season (January-March) had higher than average GDDs during the cell expansion and maturation stages.
Maturity parameters such as firmness and acid concentration, are also influenced by conditions in the 30-50 post full bloom period (Lakso et al., 2017) as well as conditions near harvest (Warrington et at., 1999). SPI and Flesh Firmness (FF) are two parameters that commonly determine harvest ‘go’ and ‘stop’ dates. Starch increases from cell expansion through to mid-season and begins to metabolise (turn into sugars) once fruit begins to mature and the rate of this differs between varieties (Lakso et al., 2017). Zhang et al 2001 found that Gala SPI start date (SPI > 1.6) was a function of the summer heat over the January/February period, while Fuji was the opposite with higher temperatures meaning a later start. In Braeburn, no relationship between maturation and temperature was found.
The high 2019 January- February GDD’s (summer heat) are evidence of maturation drivers for Gala. Consequently, the length of the growing season was curtailed given that bloom date was a few days late this season. A shorter Gala growing season means less time for cell enlargement and fruit sizing.
Solar radiation levels in February 2019, were 18% higher than the average of the preceding 7 seasons but since then they have been normal. Daily minimum (night) temperatures have been higher than normal with the February average 15% warmer than the recent average and March a balmy 28% warmer (Figure 7).
Figure 7. Comparison of 2019 daily minimum temperatures with the 2012-2018 average (Havelock North)
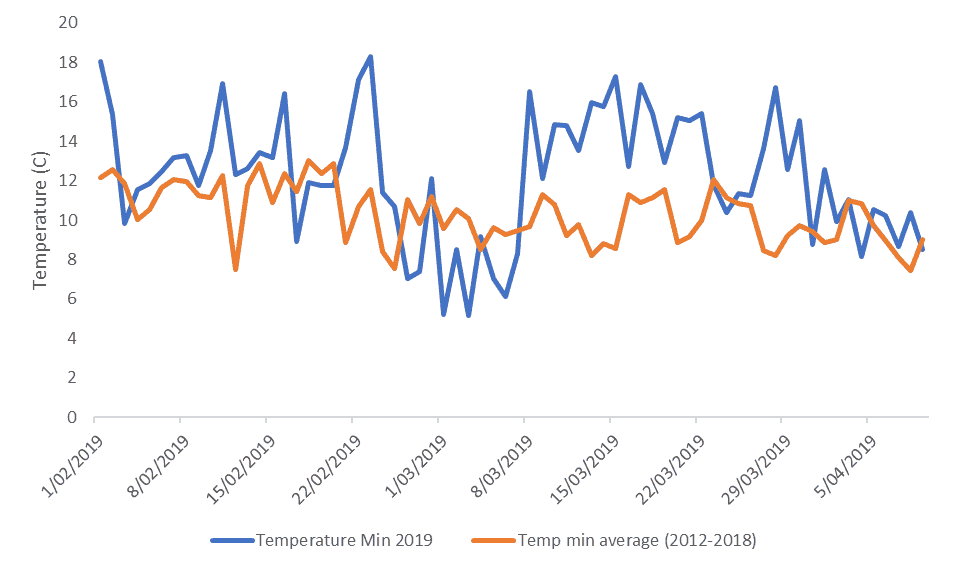
Fruit colour is determined by the amount of anthocyanin pigment, which is triggered by cool nights and warm, sunny days leading up to harvest. While 2019 conditions were pretty good for Galas, they have not been favourable for later season varieties. Warmer nights may not just restrict colour development, they also can increase the night-time respiration energy cost for trees. In high crop load situations, this may mean fewer available carbohydrate resources for colour pigment development and fruit sugar accumulation.
Crop load effects on fruit size
Crop load comes up trumps in the fruit size discussion. Higher crop loads are significantly correlated to smaller fruit. Apple fruit size for Gala apples was shown to be significantly affected by crop load (Yahya et al., 2004; Volz., 1988), and this is widely accepted by apple growers with fruit growth rates being increasingly affected as harvest approaches (unpublished data) (figure 8).
Figure 8. Effect of crop load on Royal Gala fruit growth
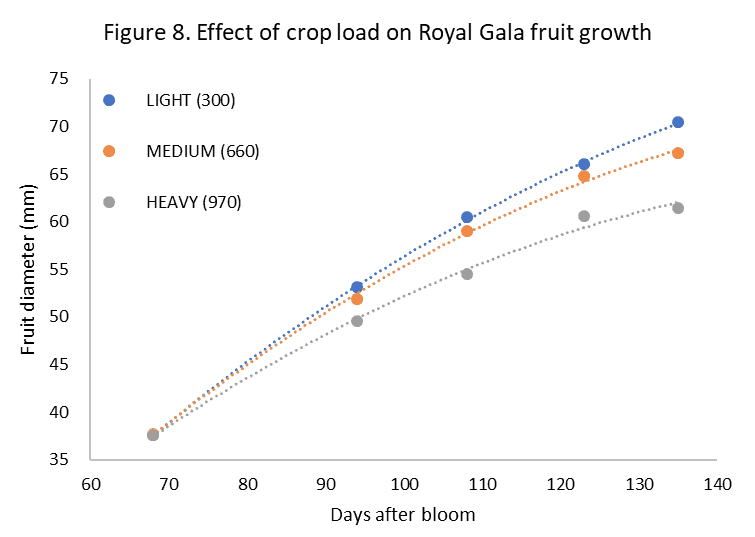
Research has shown that adjusting crop load as early as is feasible after bloom can reduce competition for resources during the cell division period and reduce the impact of high crop load on fruit size. However, Stanley et al found that while this was true under warmer temperatures, under cool climate, the absolute improvement for fruit size from thinning may be smaller.
Crop load is sought to be controlled by chemical thinning as soon as is possible during either bloom or at fruitlet stage, but results are often limited by many orchard and environmental factors. Lakso et al, 2017 describes that up to 50 factors may be involved in the thinning response with environmental factors often the limiting factor for apple response to chemical thinners. Research has shown that the thinner nathylene acetic acid (NAA) when applied late ie post bloom, with high rates or hot weather following application, can have result in smaller fruit through to harvest on ‘McIntosh’ apples (Greene et al., 2013). Fruit growth rates can be checked while trees are under stress from NAA application and never recover the lost growth despite the reduction of fruit numbers. The worst scenario would be reduced growth rates without useful thinning. There has been some increase in the use of post-bloom NAA’s in combination with benzyledenine. Could this thinning mix be a fruit size factor?
Metamitron, is a photosynthetic inhibitor which works by reducing the trees ability to photosynthesize therefore causing fruit abscission. The effectiveness of this chemical thinner relies on the applicator understanding the carbohydrate supply/demand balance which is affected by solar radiation and temperature before and after application (Lakso et al., 2017). Metamitron also checks fruit growth as a consequence of temporarily shutting down photosynthetic rates. The same fruit growth response issues could potentially arise with this new chemistry, but we have not measured any commercially significant effects on final fruit size from metamitron thinning (client privledged data).
When applied correctly, chemical thinners should reduce crop load in the vital period before 50 DAFB, which in turn can increase fruit size by better partitioning tree resources to the remaining fruitlets which are still in the cell division stage. Thought should be given to the response of each variety to the thinner, under successful and unsuccessful application and the impact of thinning response on fruit growth.
Management and variety issues
The orchards sampled in the NZAPI HB maturity monitoring programme have changed over time. Our two largest growers now comprise most of this data set (67% of the sampled orchards for five late season varieties). The whole sample group has generally carried big crops this season. In an informal assessment of crop load levels on the sampled blocks, 63% were categorised as ‘medium’ and 29% as ‘heavy’. This raises the question about how wide the effects of high crop load levels on fruit size and quality are? There are also ‘variety pecking order’ and labour supply factors. A variety like Braeburn which faces dimmer market prospects has often received lower priority management being less likely to be thinned well and harvested on time. EnvyTM on the other hand has benefited from careful and timely crop husbandry. There might be a self-fulfilling aspect to market and customer acceptability results for these varieties as a consequence.
There are admittedly many inter-related and moving parts contributing to the final result but we propose the following probable causes for slightly less than stellar apples this season:
- Cooler conditions restricting early season cell division
- High crop load levels limiting fruit assimilate supply
- Shorter growing season for sizing
- Unfavourable late season carbohydrate balance conditions
What do you think?
References
Stanley, C.J., Stokes, J.R. and Tustin, D.S. (2001). Early prediction of apple fruit size using environmental indicators. Acta Hortic. 557, 441-446
Calderón-Zavala, G., Lakso, A.N. and Piccioni, R.M. (2004). Temperature effects on fruit and shoot growth in the apple (malus domestica) early in the season. Acta Hortic. 636, 447-453
Warrington, I. J., Fulton, T. A., Halligan, E. A., & De Silva, H. N. (1999). Apple fruit growth and maturity are affected by early season temperatures. Journal of the American Society for Horticultural Science, 124(5), 468-477.
Al-Hinai, Y. K., & Roper, T. R. (2004). Rootstock Effects on Growth, Cell Number, and Cell Size ofgala’apples. Journal of the american society for horticultural science, 129(1), 37-41.
Volz, R. K. (1988). Regulation and estimation of crop load on ‘Gala’apple trees. New Zealand Journal of Experimental Agriculture, 16(1), 47-53.
Lakso, A. N., & Goffinet, M. C. (2017). Advances in understanding apple fruit development. In Achieving sustainable cultivation of apples (pp. 127-158). Burleigh Dodds Science Publishing.
Greene, D. W., & Lakso, A. N. (2013). Prediction of initial set and the thinning response to postbloom chemical thinners on apples. International journal of fruit science, 13(4), 430-440.
Maturity Monitoring Data, Jamieson Maddock Ltd on behalf of New Zealand Apples and Pears